![[OCB Home]](/images/homeb.gif)
![[Directory]](/images/dir.gif)
03 July 2008: Prepared for OCB data system by Cyndy Chandler, OCB DMO (WHOI) from documentation contributed by Chief Scientist Ken Buesseler (WHOI)
Relative Locations of R/V ROger Revelle RR K2 CTD Stations and
Sediment Trap Trajectories
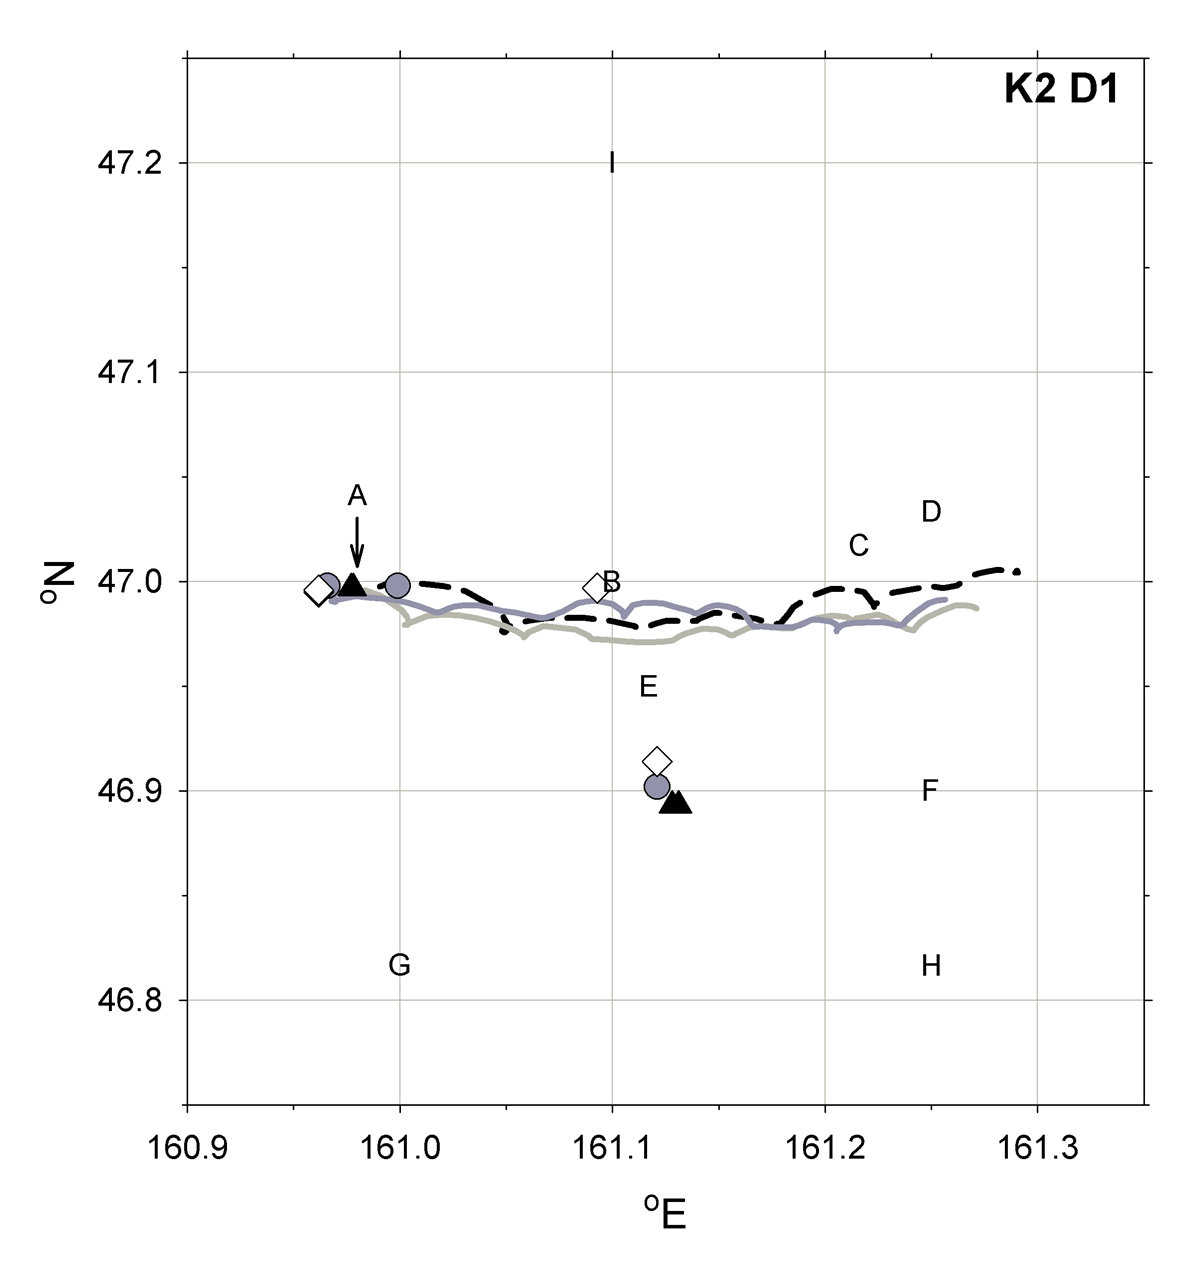
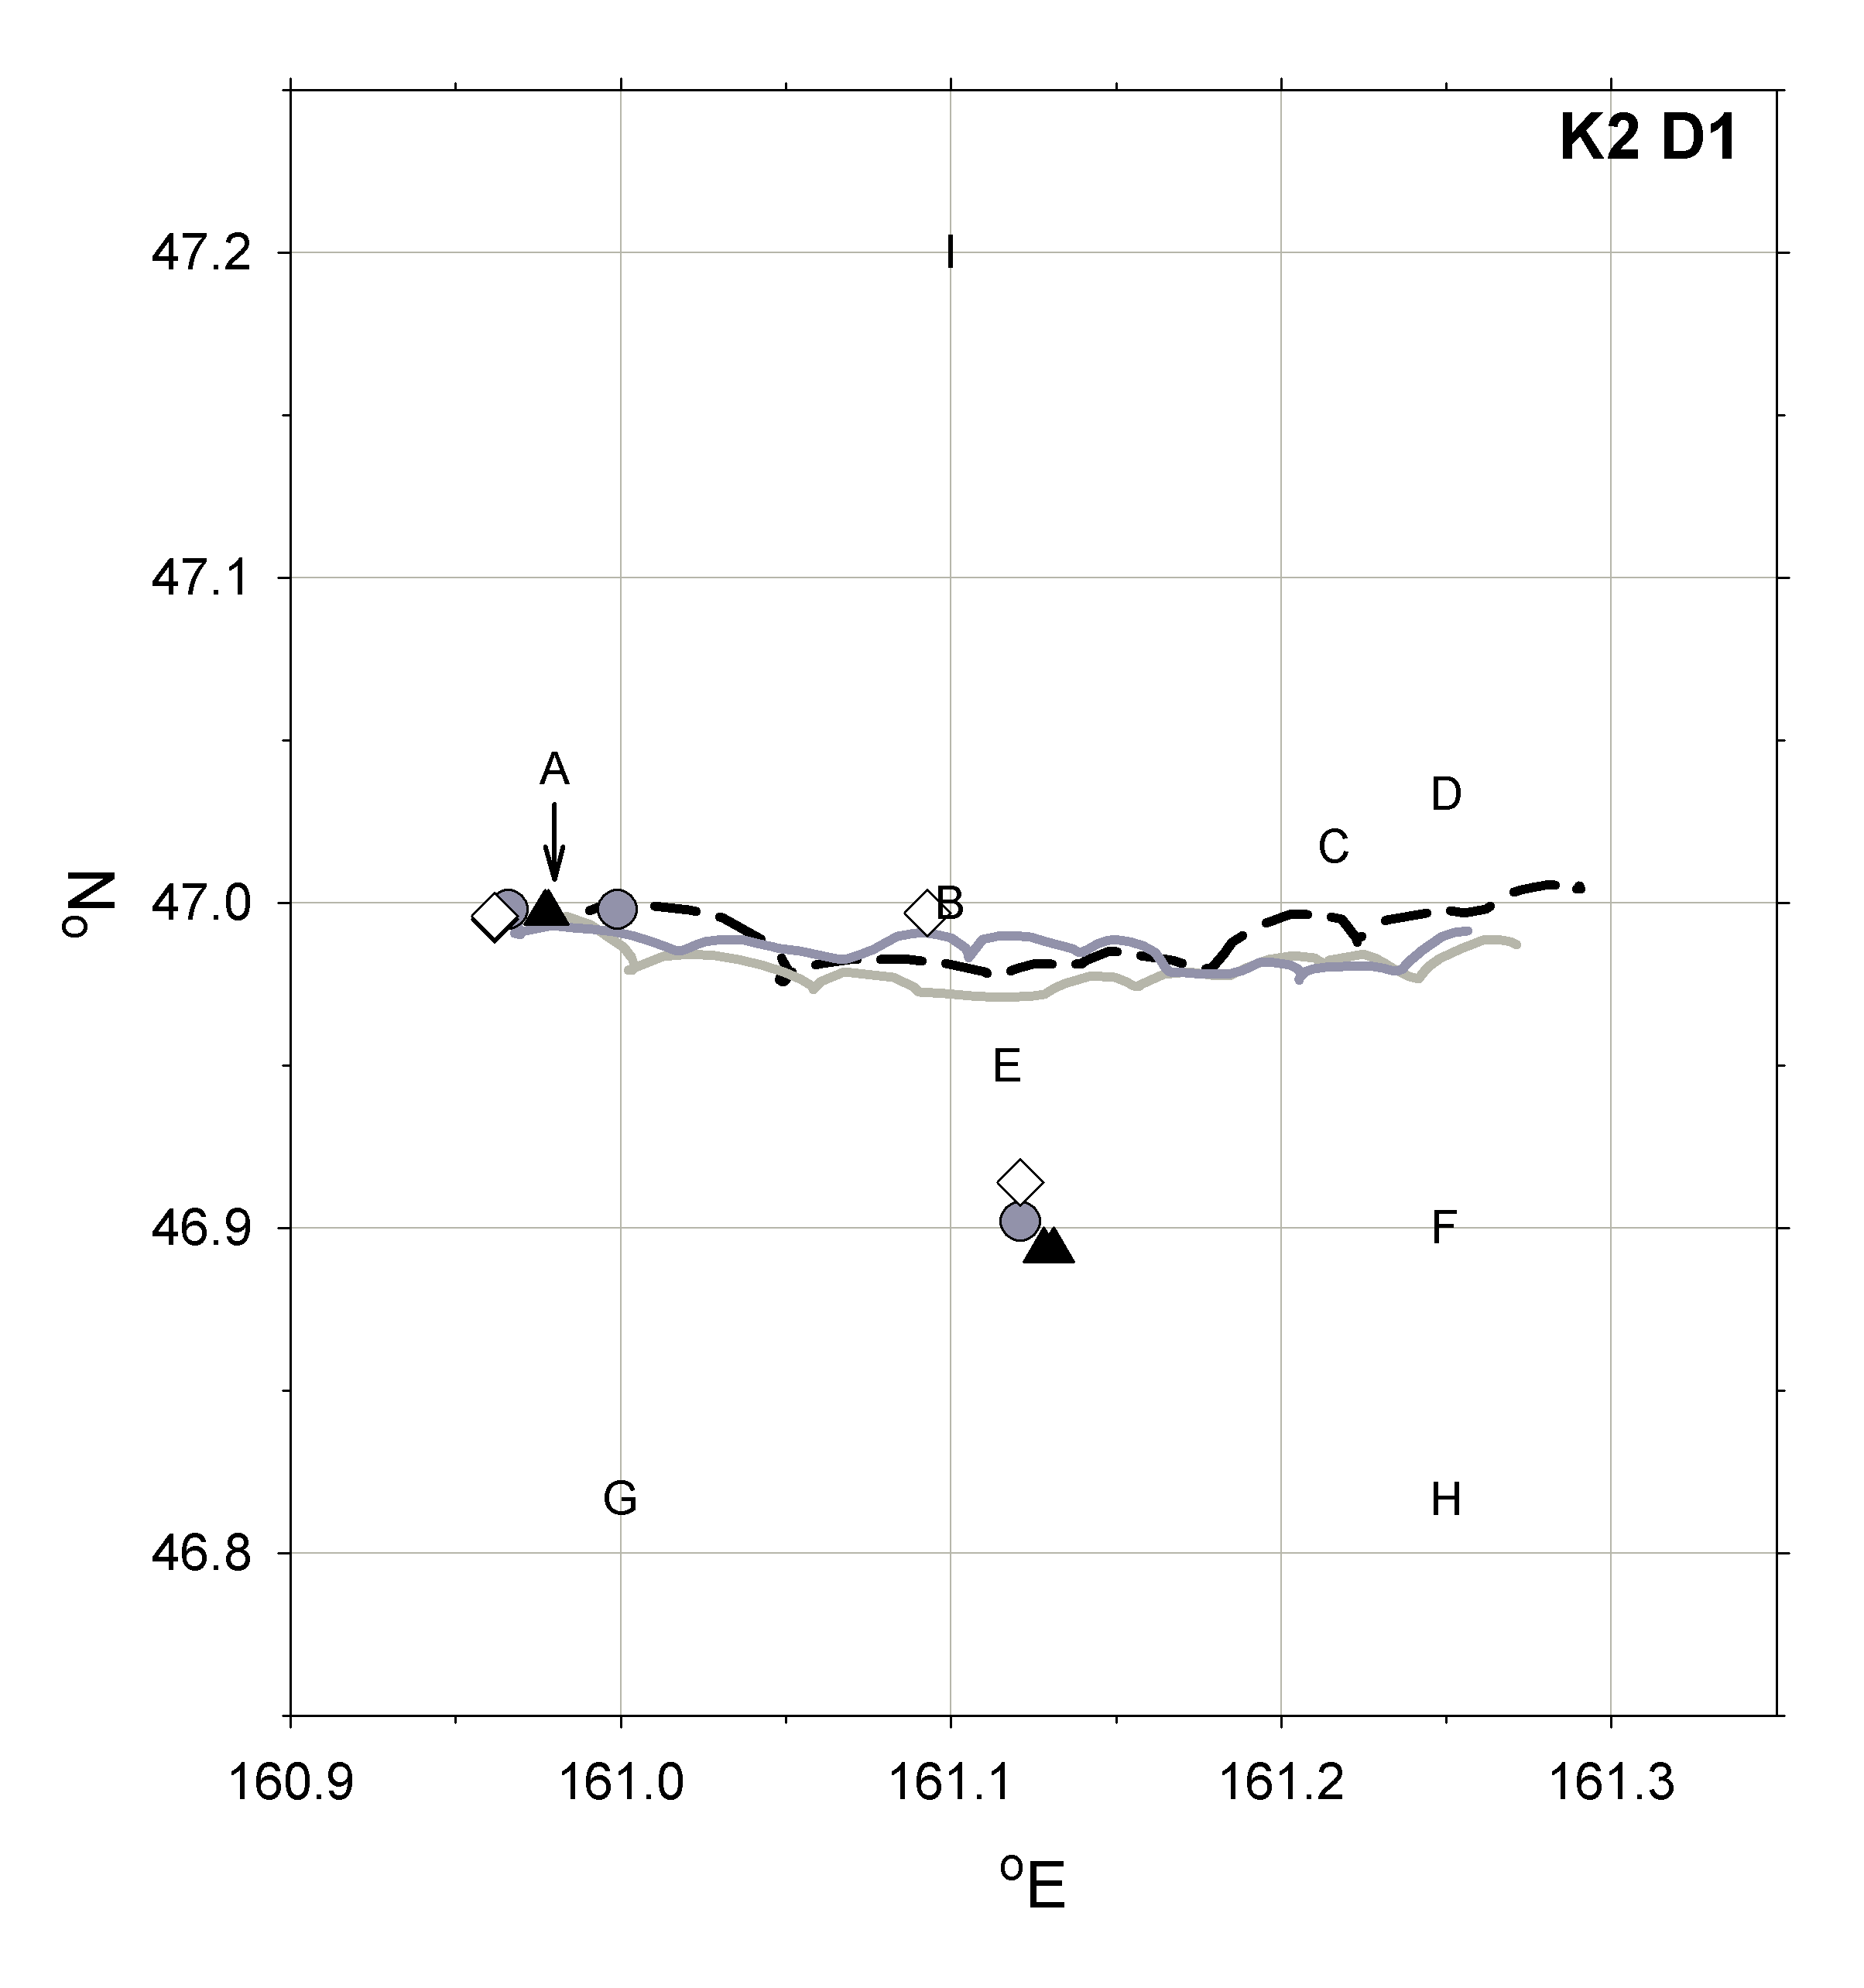
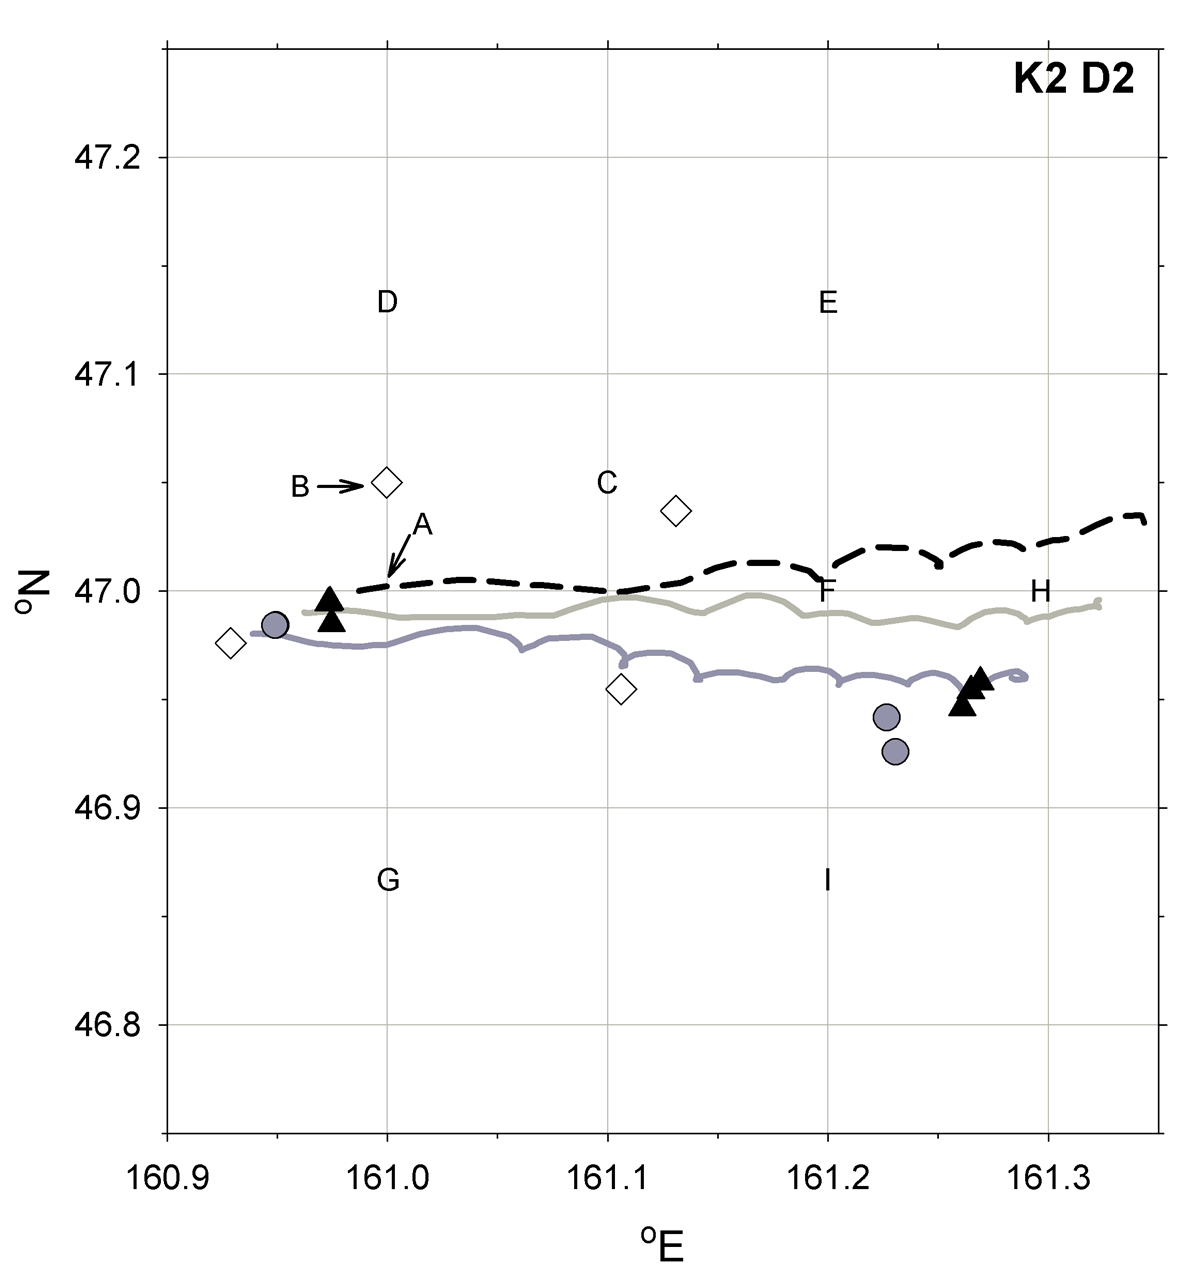
Sediment trap trajectories and locations of CTD stations are shown for each of two deployments (D1 and D2) during the VERTIGO occupation of the K2 site during the R/V Roger Revelle RR K2 cruise in 2005. Multiple NBST deployments are identified by the following symbols: 150 meters are black triangles, 300 meters are gray circles, 500 meters are white diamonds. CLAP trap trajectories are shown as continuous tracks and are identified by the following: 150 meters is black, 300 meters is light gray, 500 meters is dark gray.
Note that overlapping CTD stations have been combined into one identifier and those indicated by arrows have been slightly adjusted so that trap trajectories do not overlap.
CTD stations occupied during trap deployments are indicated by letters as indicated in the legend below each map figure.
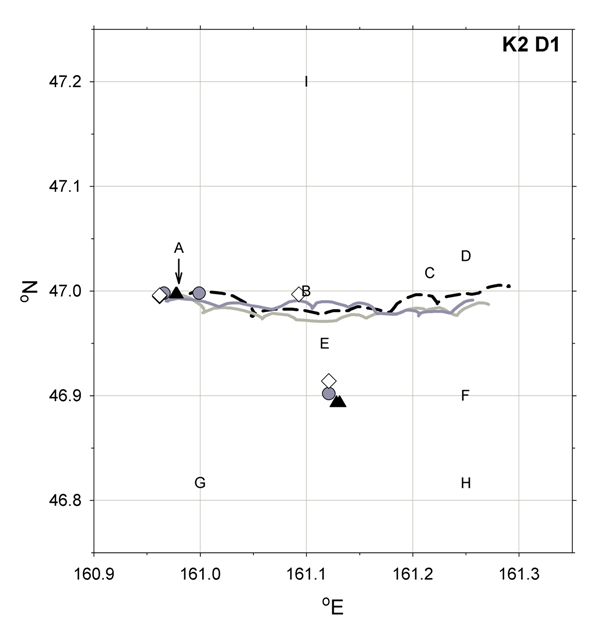
K2 D1: CTD 17-36 (34 not on grid)
A= 17,18,19,20,21,22,23,24,28 B= 25 C= 26 D= 27,31,35 E=29 F=30 G=32 H= 33 I= 36
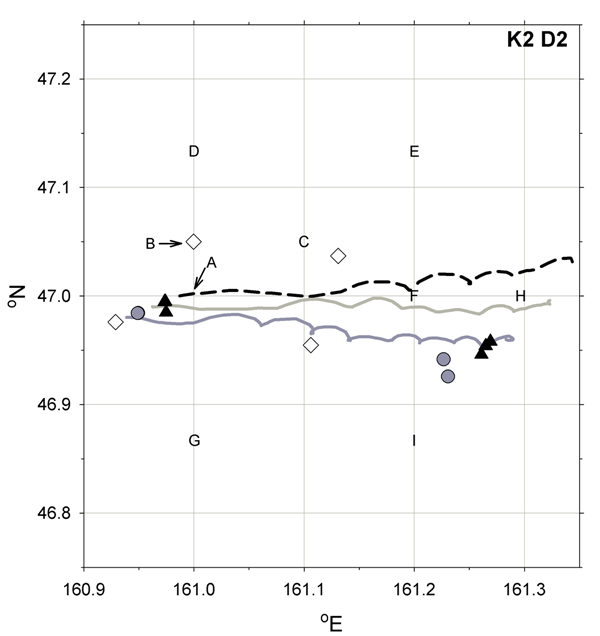
K2 D2: CTD 59-77 (60,61,74 not on grid)
A= 59 B= 62,63,64,65,66,67,68 C=69 D=70 E=72,73 G= 75 H= 76 I=77
These figures will be published in:
Buesseler, K.O., T.W. Trull, D.K. Steinberg, M.W. Silver, D.A. Siegel, S.-I. Saitoh, C.H. Lamborg, P.J. Lam, D.M. Karl, N.Z. Jiao, M.C. Honda, M.Elskens, F. Dehairs, S.L. Brown, P.W. Boyd, J.K.B. Bishop and R.R. Bidigare (2008). VERTIGO (VERtical Transport In the Global Ocean): a study of particle sources and flux attenuation in the North Pacific. In press Deep-Sea Research II.
Eight inch versions of the map images (suitable for printing) are available as well as the original full sized image files (16x17 inches).
K2 D1: 8 inch | full size
K2 D2: 8 inch | full size
Contact: Ken Buesseler (WHOI)
![]() Go back to your previous page
Go back to your previous page